The Dangers of High-Cardinality Labels in Prometheus
We’re all familiar with the warnings: “Don’t use user_id as a Prometheus label” or “Don’t use transaction codes as labels — they can crash Prometheus”. But do we really understand why these are so dangerous?
Before that, we need to know how Prometheus works.
How Prometheus Works
Prometheus is an open-source systems monitoring and alerting tool that collects and stores its metrics as time-series data. It periodically scrapes metrics from your services based on the configured interval.
This is an example of the config:
scrape_configs:
  - job_name: 'golang-app'
    static_configs:
      - targets: ['localhost:8080']
    scrape_interval: 5s
This config will tell Prometheus to:
Target: send an HTTP request GET to http://localhost:8080/metrics
Periodically: for every 5 seconds
Label: with job=golang-app
Prometheus has three metric types:
- Gauges — represent current measurements and reflect the current state of a system (CPU, memory usage)
- Counters — measure discrete events that continuously increase over time (HTTP requests, CPU seconds, bytes sent)
- Histogram — distribution of observed values, exposed as bucket, sum, and count metrics
Time Series Database (TSDB)
Prometheus collects and stores metrics as time series. Each time series is uniquely identified by a metric name and a set of labels, while each sample within the series contains a timestamp and a value.
Each unique combination of labels (method, path, and status) represents a separate time series whose value increases as more requests are processed, with total method x path x status.

In the Counter metrics example, suppose we have two endpoints: GET: /api/data, GET: /api/users, and each of which can return either a 200 or 500 status code.
This results in the following metrics:
http_requests_total{method="GET", path="/api/data", status="200"} 17
http_requests_total{method="GET", path="/api/data", status="500"} 0
http_requests_total{method="GET", path="/api/users", status="200"} 10
http_requests_total{method="GET", path="/api/users", status="500"} 2
Because each time series represents a unique combination of labels, these four label combinations produce four distinct time series. In the time-series database (TSDB), each of these time series is stored independently:
// time series 1
2026-02-19 09:00:00 | {__name__="http_requests_total", method="GET", path="/api/data", status="200"} | 15
2026-02-19 09:00:05 | {__name__="http_requests_total", method="GET", path="/api/data", status="200"} | 16
2026-02-19 09:00:10 | {__name__="http_requests_total", method="GET", path="/api/data", status="200"} | 17

// time series 2
2026-02-19 09:00:00 | {__name__="http_requests_total", method="GET", path="/api/data", status="500"} | 0
2026-02-19 09:00:05 | {__name__="http_requests_total", method="GET", path="/api/data", status="500"} | 0
2026-02-19 09:00:10 | {__name__="http_requests_total", method="GET", path="/api/data", status="500"} | 0

// time series 3
2026-02-19 09:00:00 | {__name__="http_requests_total", method="GET", path="/api/users", status="200"} | 8
2026-02-19 09:00:05 | {__name__="http_requests_total", method="GET", path="/api/users", status="200"} | 9
2026-02-19 09:00:10 | {__name__="http_requests_total", method="GET", path="/api/users", status="200"} | 10

// time series 4
2026-02-19 09:00:00 | {__name__="http_requests_total", method="GET", path="/api/users", status="500"} | 1
2026-02-19 09:00:05 | {__name__="http_requests_total", method="GET", path="/api/users", status="500"} | 2
2026-02-19 09:00:10 | {__name__="http_requests_total", method="GET", path="/api/users", status="500"} | 2
The Dangers
Let’s go back to the warning: “Don’t use user_id as a Prometheus label” or “Don’t use transaction codes as labels — they can crash Prometheus.”
Imagine you want to record transaction latency using metric labels such as:
status: pending, paid, success, failed
payment_type: wallet, cash
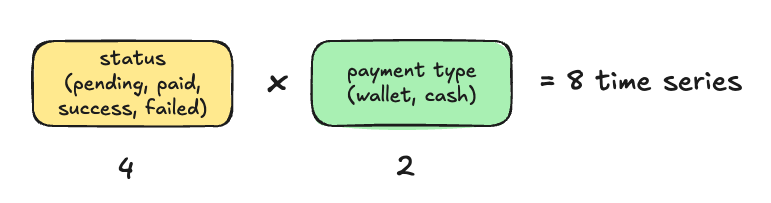
Here, status has 4 possible values, payment_type has 2 possible values. It will produce status (4) x payment_type (2) = 8 time series
This is the example result of the metrics:
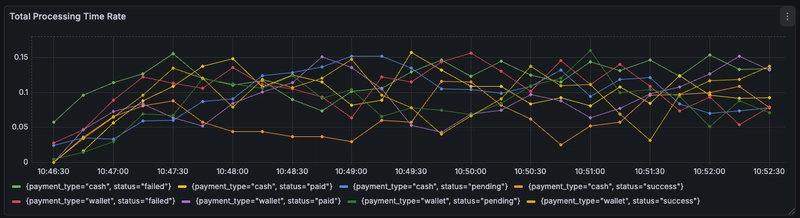
there are exactly 8 label for the metrics
Then, you adjust the metrics by adding a code label, allowing request rates, error rates, and traffic patterns to be broken down per transaction
code: a unique identifier for each transaction
However, code is unique for every transaction and grows continuously with request volume.
As a result, the number of possible values for code is unbounded and increases over time. status (4) × payment_type (2) × code (∞) = ∞ time series

This is the example result of the metrics:
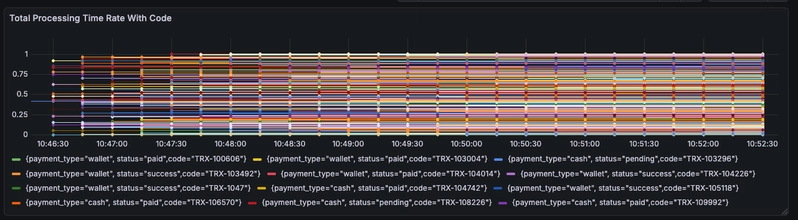
This single unbounded label is enough to turn an otherwise manageable metric into a high-cardinality time-series explosion that can cause memory exhaustion and query performance.

Summary
Adding labels whose values grow unbounded over time—such as UUIDs, timestamps, user IDs, or transaction codes—is strongly discouraged. These labels rarely add meaningful value at the metrics level and introduce high cardinality. For high-cardinality data, better use logging, not metrics
High-cardinality labels can lead to serious issues, including:
- Huge memory usage — each unique label set creates a new time series
- Rapid disk growth
- Slow queries
- Scrape performance issue
It’s better to use labels that have semantic meaning, and strongly recommended to keep the number of labels to a minimum
A wise man says, “Never use a label whose value grows with users, requests, or time.”
Good labels describe what something is, not who or which exact instance.